
Figure 7.
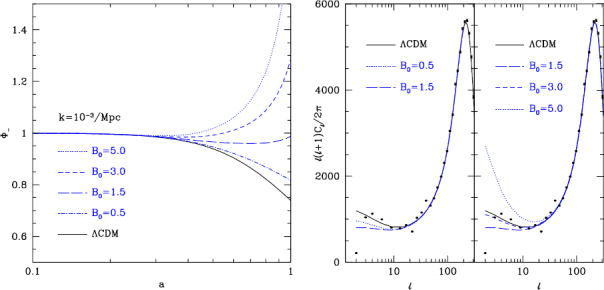
(Left) Evolution of the effective gravitational potential Φeff (denoted as Φ− in the figure) versus the scale factor a (with the present value a = 1) on the scale k−1 = 103 Mpc for the ΛCDM model and f(R) models with B0 = 0.5, 1.5, 3.0, 5.0. As the parameter B0 increases, the decay of Φeff decreases and then turns into growth for B0 ≳ 1.5. (Right) The CMB power spectrum ℓ(ℓ + 1)Cℓ/(2π) for the ΛCDM model and f(R) models with B0 = 0.5, 1.5, 3.0, 5.0. As B0 increases, the ISW contributions to low multipoles decrease, reach the minimum around B0 = 1.5, and then increase. The black points correspond to the WMAP 3-year data [561]. From [545].