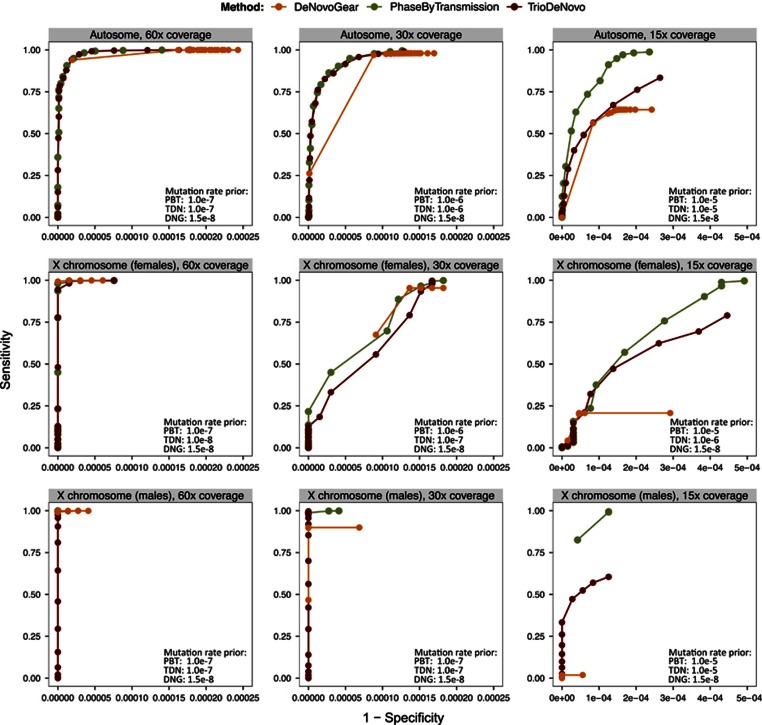
Figure 3.
ROC plot illustrating the performance of three DNM calling methods (PhaseByTransmission, TrioDeNovo and DeNovoGear), with respect to each method's DNM output confidence score. The analysis is stratified by coverage (columns) and genomic region (rows). The posterior cutoffs used for plotting each curve were uniformly distributed across the range of each tool's output DNM confidence scores. Some outlier values where the specificity decreased considerably without any sensitivity gain were removed from the plot and the x-scale for the 60x and 30x coverages is restricted, for visibility purpose. Supplementary Figure SF3 shows the curves with all points. The mutation rate prior values for each scenario, for each tool are selected based on Supplementary Figure SF1.

