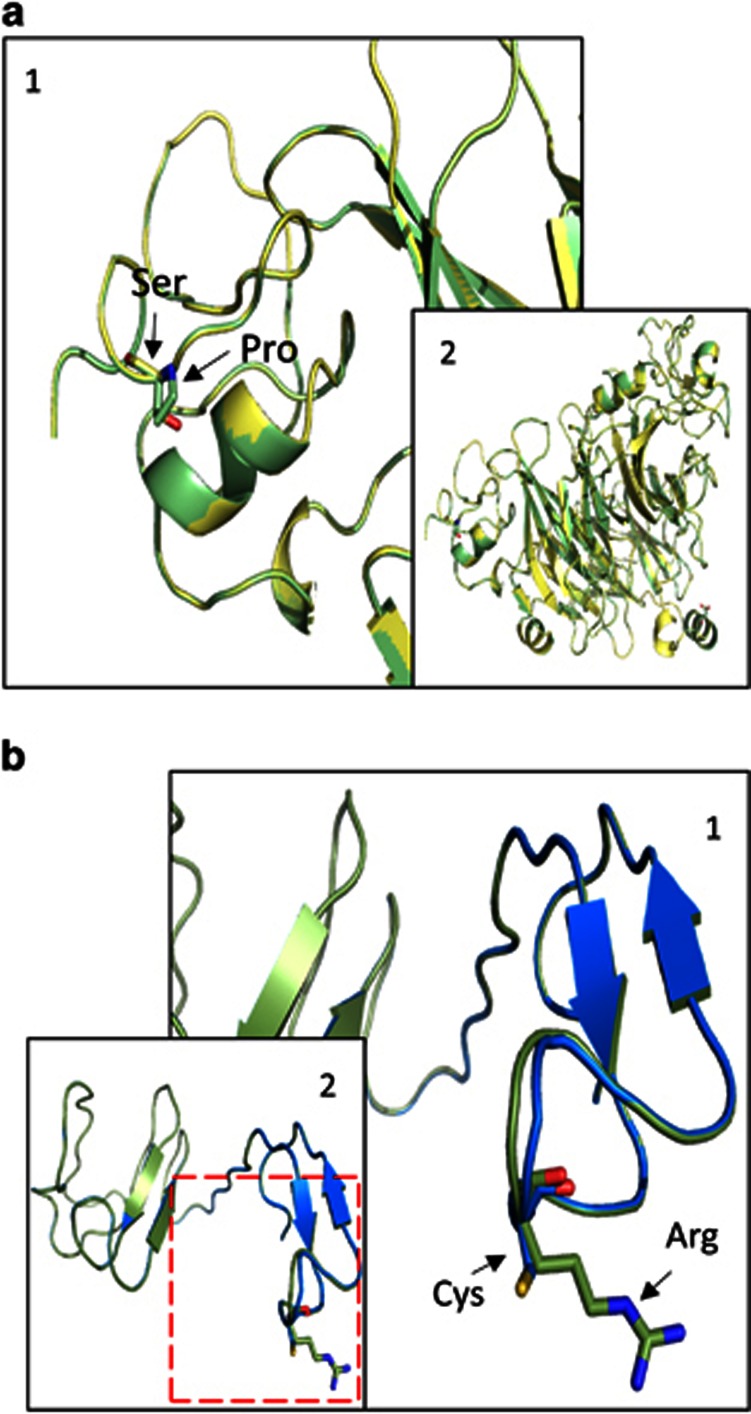
Figure 3.
Three-dimensional protein models. (a) Structural differences between predicted mutated Semaphorin-3D protein model. Superimposition of normal (green) and mutant (yellow) Semaphorin-3D protein model. (b) Structural differences between predicted mutant Dermatopontin protein models. Superimposition of normal Dermatopontin protein model (Green) and mutant Dermatopontin protein model (Blue). Amino-acid changes are marked with arrows.

