Figure 2.
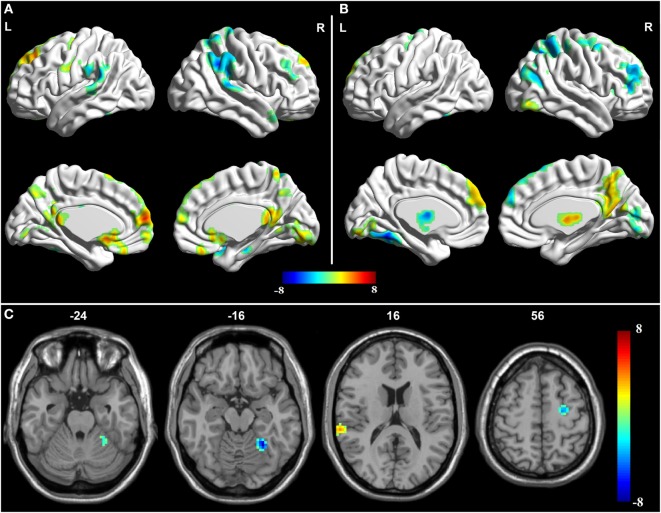
Granger causality analysis for the posterior cingulate cortex (PCC) to whole brain. (A) Brain regions showing significant causal effect with the PCC in controls. (B) Brain regions showing significant causal effect with the PCC in amnestic mild cognitive impairment (aMCI) patients. Warm and cold colors denote positive and negative causal effects (p < 0.05), respectively. (C) Brain regions showing group differences in causal effect from the PCC in a comparison of aMCI versus control. Blue areas show brain regions where aMCI patients had reduced causal effects than controls. The color bar represents t-values.

