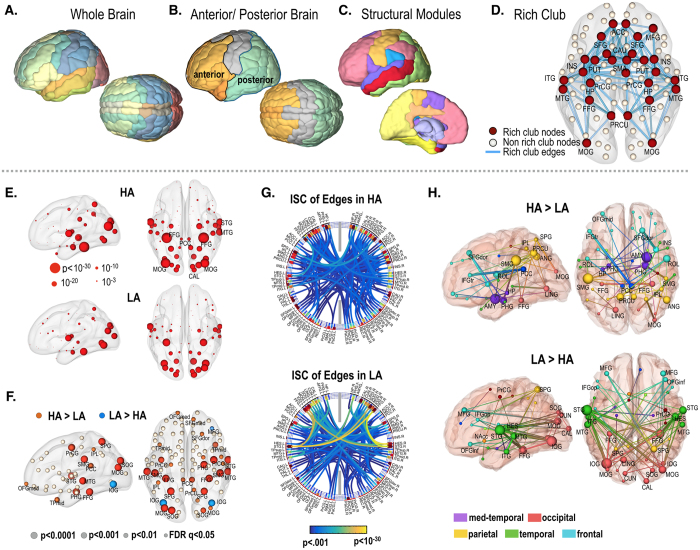
Figure 1. Subnetworks of the brain used in this study.
Network node and edge definitions using the Automated Anatomical Labeling (AAL) map of the whole brain (A), anterior and posterior areas of the brain (B), modules defined by modularity optimization of structural networks for inter/intra-modular connectivity analysis (C) and rich-club nodes defined by structural networks (D). Rich-club nodes (node degree >16, red spheres) were found at the anterior cingulate cortex (ACC), caudate (CAU), fusiform gyrus (FFG), hippocampus (HP), inferior temporal gyrus (ITG), insula (INS), middle cingulate cortex (MCC), middle frontal gyrus (MFG), middle occipital gyrus (MOG), middle temporal gyrus (MTG), precentral gyrus (PrCG), precuneus (PRCU), putamen (PUT), superior dorsal frontal Gyrus (SFGdor) and supplementary motor area (SMA). Inter-subject correlation (ISC) of nodes and edges. (E) T-maps of ISC for nodal activity at high and low arousal states (HA, and LA) (one sample t-test). (F) Statistical difference of nodal synchronization (ISC) across individuals between the high and low arousal states (blue depicts greater synchrony in LA and orange represents greater synchrony in HA). FDR q < 0.05. (G) T-maps of ISC for dynamic functional connectivity in the high and low arousal state (one sample t-test). Edges with z-transformed ISC > 2 were displayed. (H) Statistical difference of edge synchronization (ISC of functional connectivity) across individuals between the high and low arousal states. FDR q < 0.05.

