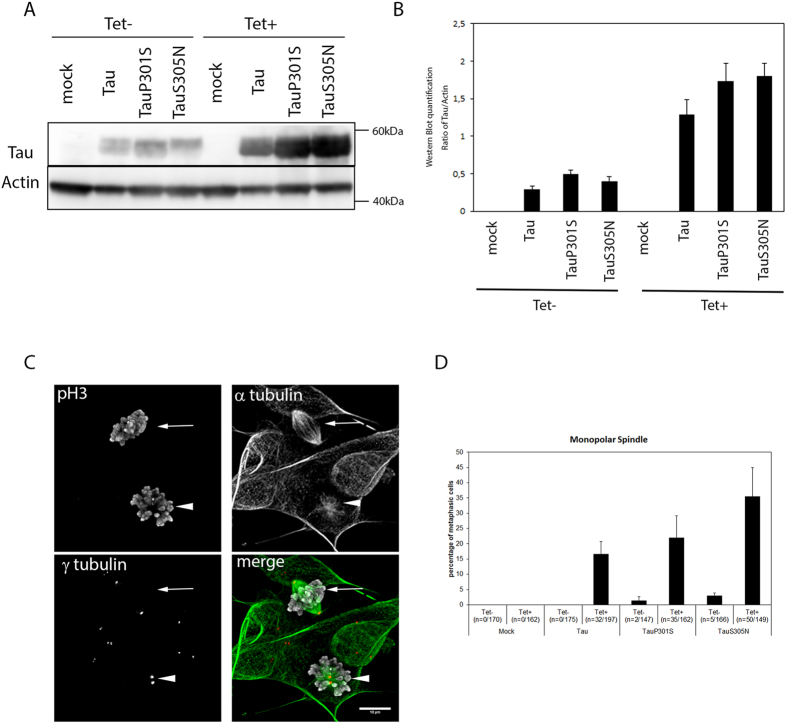
Figure 7. Monopolar spindle phenotype in human SH-SY5Y neuroblastoma cell line model following expression of wild-type and mutant 4R-Tau isoforms.
(A) Western blot in mock and Tau cell lines showing the increase in Tau protein levels upon tetracycline induction. (B) Quantification of Tau protein level upon tetracycline induction. The corresponding full-length western blot is presented in Sup Fig. 5C. (C) Representative image of a monopolar spindle (arrowhead) close to a normal bipolar spindle (arrow) in Tau-expressing cells (scale bar = 10 μm). (D) Quantification of the percentage of monopolar spindle in the Tau-expressing cells (mean ± SD, the number of monopolar spindles out of the total number of mitotic cells after nuclear envelop breakdown over 3 independent experiments is indicated in the legend of the x-axis).

