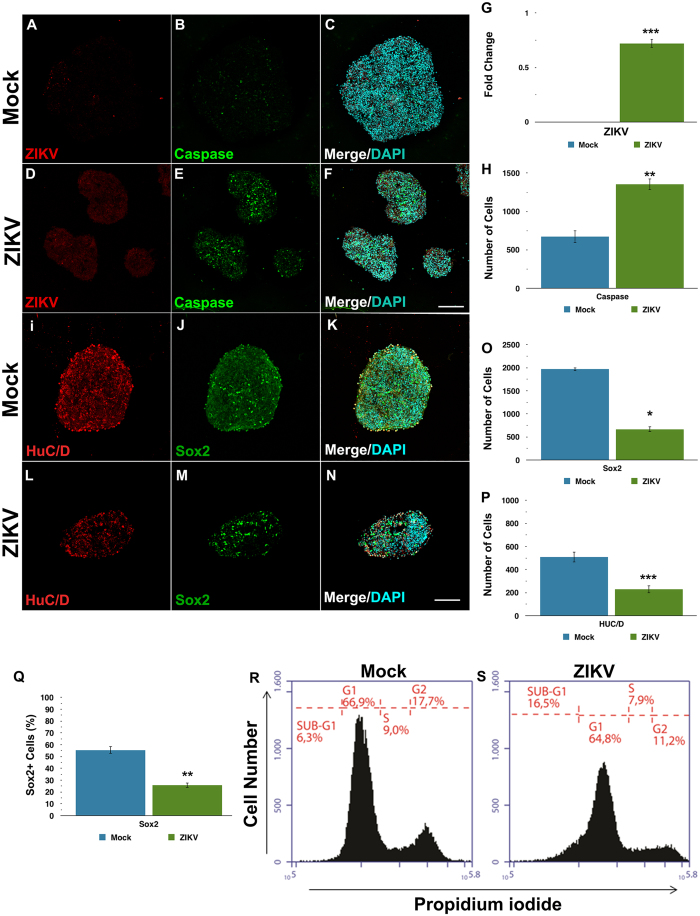
Figure 2. ZIKV reduces the growth of neurospheres, by depleting the pool of neural progenitors and the generation of neurons.
(A–F) Immunocytochemistry for the flavivirus antigen (red) and cleaved caspase-3 (green) counterstained with DAPI (blue) on Mock- and ZIKV-infected neurospheres. (G) Quantification of flavivirus antigen and (H) cleaved caspase-3 fluorescence intensity. Individual sample data were normalized against the average of Mock-infected experimental group. (I–P) Immunocytochemistry for the neuronal marker HuC/D (red) and the neural progenitor marker SOX2 (green) counterstained with DAPI (blue). Quantification of HuC/D and SOX2 fluorescence intensity shows a decrease of both markers on ZIKV-infected neurospheres. (Q,R) Flow cytometry distribution analysis of neurospheres at subG1 phase of cell cycle 3 days after ZIKV or mock infection. Differences on bar graphs were expressed by fold change in relation to the average values of the Mock-infected group. Data presented as mean ± SD, n = 4, Student’s t-test, *p < 0.05; **p < 0.01; ***p < 0.001.

