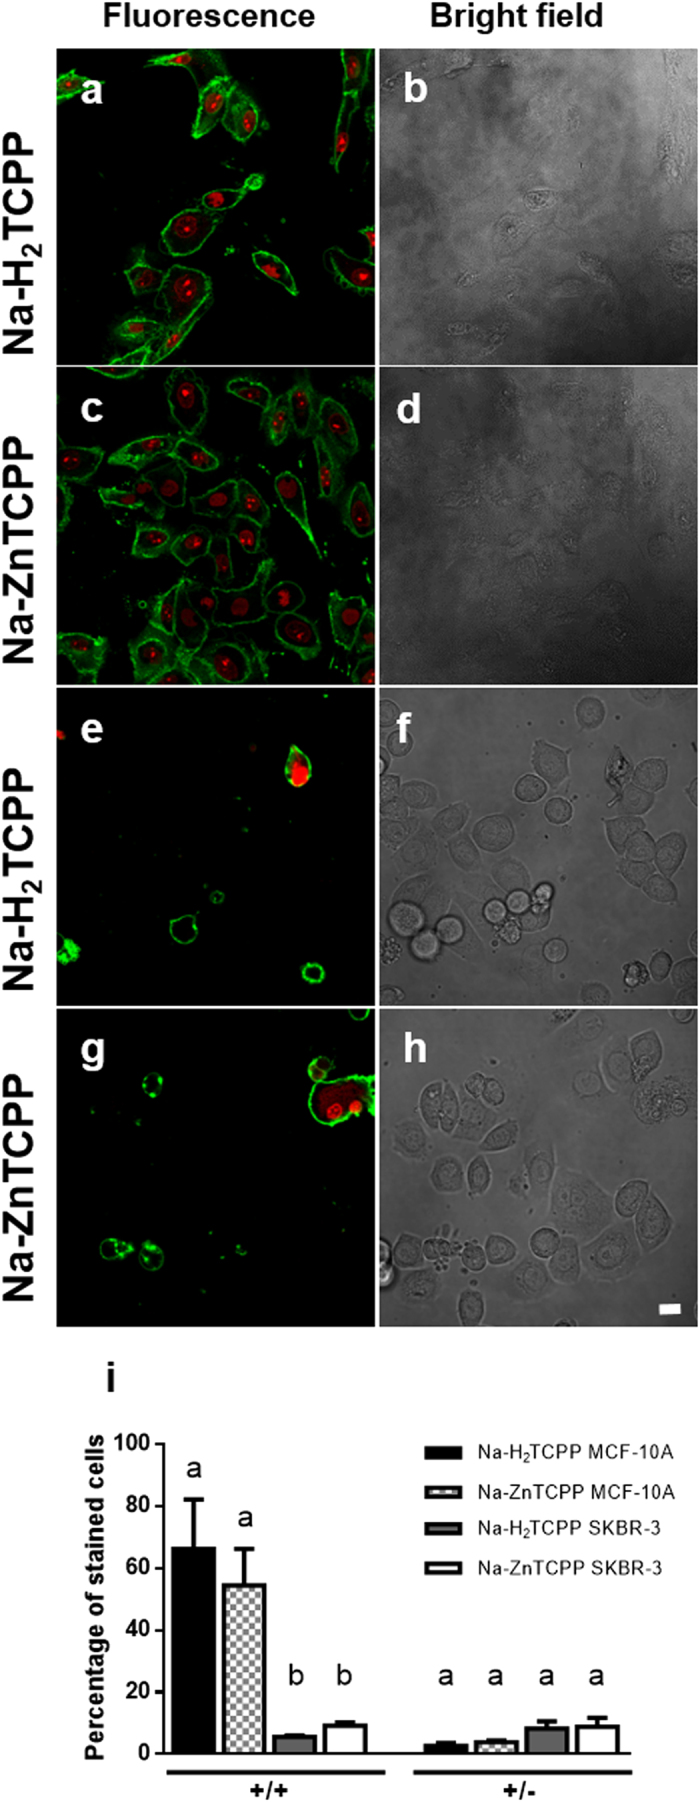
Figure 5. Cells processed with Annexin-V-FLUOS Staining Kit 2 h after irradiation and observed under fluorescence or bright field microscope.

(a,b) MCF-10A cells incubated with 4 μM Na-H2TCPP. (c,d) MCF-10A cells treated with 4 μM Na-ZnTCPP. (e,f) SKBR-3 cells incubated with 4 μM Na-H2TCPP. (g,h) SKBR-3 cells treated with 4 μM Na-ZnTCPP. Green fluorescence corresponds to Annexin-V-FLUOS (ANV) and red fluorescence to propidium iodide (PI). Scale bar, 20 μM. (i) Percentage of ANV+/PI+ or ANV+/PI− cells observed 2 h after photodynamic treatments with 4 μM Na-H2TCPP or Na-ZnTCPP. Different superscripts on top of the columns denote significant differences between groups not sharing the same superscript within the cells +/+ and +/− for ANV/IP assay.
