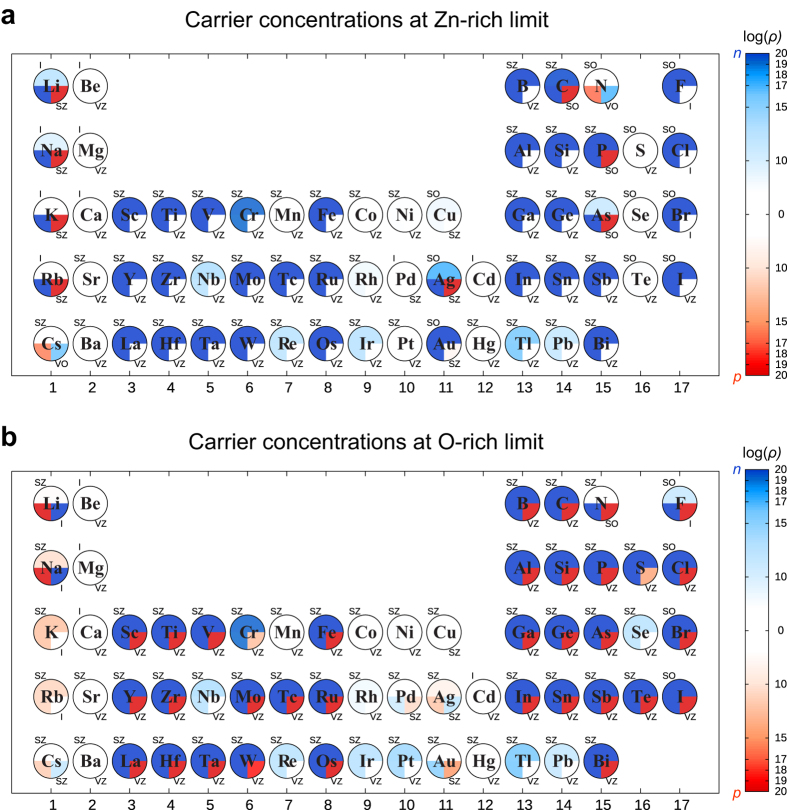
Figure 5.
Carrier concentrations at (a) Zn-rich and (b) O-rich conditions when the dopant concentration is fixed to 1020 cm−3 at 300 K. The blue and red represent the electron- and hole-carrier concentration, n and p, respectively. The total carrier concentration is color-coded within the upper half circle. The lower-left quadrant indicates the concentration of major charged configuration and the lower-right quadrant indicates the density of its largest compensating defect. The dopant or defect concentrations are colored according to their charge state (blue (red) indicates + (−) charge state and donor (acceptor)-like nature). Labels around the circle indicate the type of major or compensating defects (SZ: Zn substitutional, SO: O substitutional, I: interstitial, VZ: Zn vacancy, VO: oxygen vacancy).

