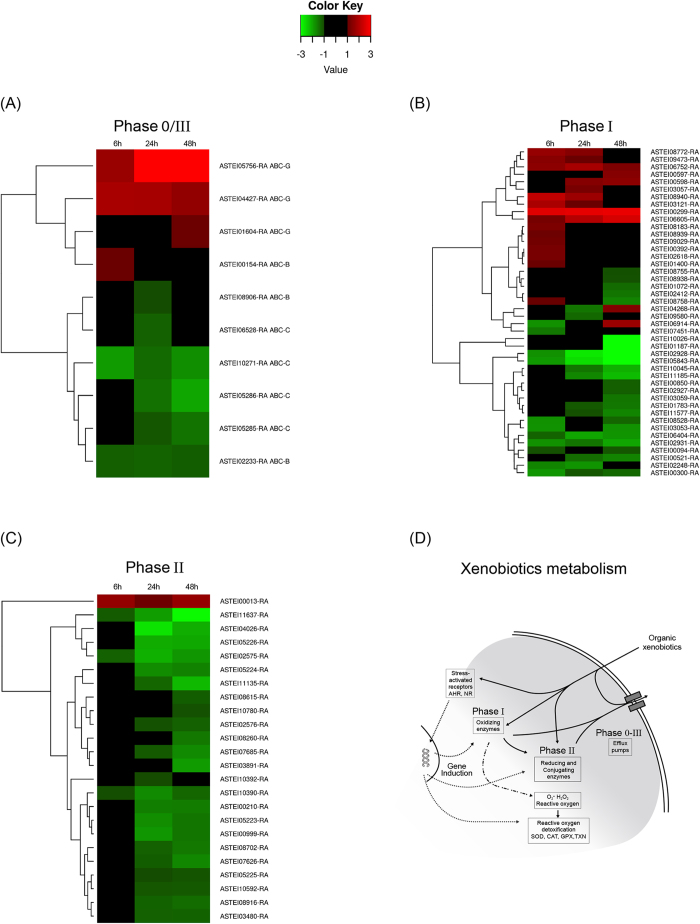
Figure 4. Differentially expressed genes in mosquito larvae exposed to permethrin at six, 24 and 48 h.
Hierarchical clustering analysis based on their log fold-change. Genes not differentially expressed in any time-point were excluded from the analysis. For each gene, the ID is also indicated. (A) Phase 0/III enzymes: ABC transporters; (B) Phase I enzymes: Cytochrome P450 and Carboxylesterases; (C) Phase II enzymes: Glutathione S-transferases and UDP-glucuronosyltransferases. (D) Graphical representation of the chemical defensome. In the figure, the detoxifying metabolic enzymes and the pathways involved are shown. The figure was traced and modified from1, using the software Canvas 15 (ACD systems http://www.acdsee.com/de/products/canvas-15).

