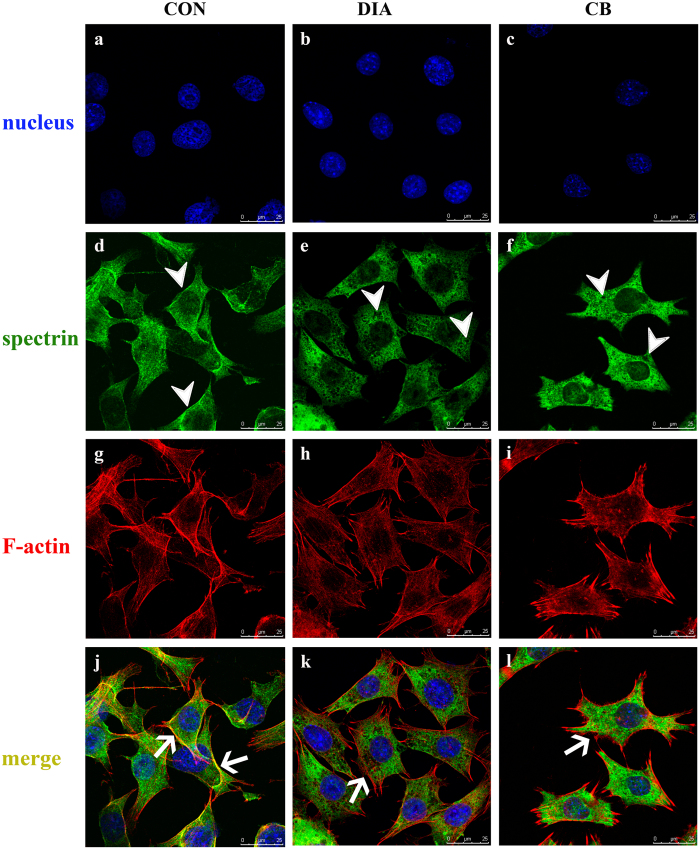
Figure 2. The distributions of spectrin and F-actin of osteocytes were examined by the double-label fluorescence staining.
In the control group (j), the spectrin network (green) was co-localized with the F-actin (red) on the membrane (golden, indicated by the arrow); the treatment of DIA disrupted the spectrin network, and some holes were shown in the cytoplasm (e, indicated by the arrow head), while the F-actin stress fibers were unbroken (h), but the colocalization of spectrin and F-actin on the membrane disappeared (k, indicated by the arrow); the treatment of CB also broke the spectrin network (f, indicated by the arrow head), but to a lower degree compared with the DIA group, and the F-actin was disrupted to short and broken fibers (i), and the colocalization with spectrin on the membrane also disappeared (l, indicated by the arrow).

