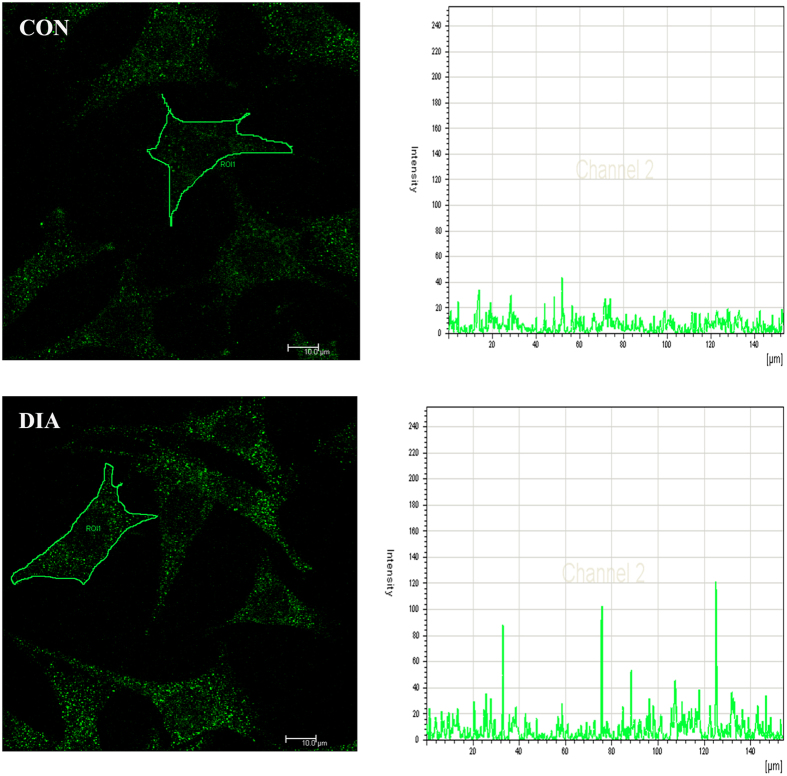
Figure 7. The eNOS of MLO-Y4 osteocyte was fluorescent stained.
In the CON group, the eNOS (green) was distributed evenly in the cytoplasm and the intensity profile showed a small variance of the fluorescence distribution. While in the DIA group, the strong staining of the eNOS (indicated by the arrow) and the peak values in the intensity profile both indicated the accumulation of eNOS in the cytoplasm.

