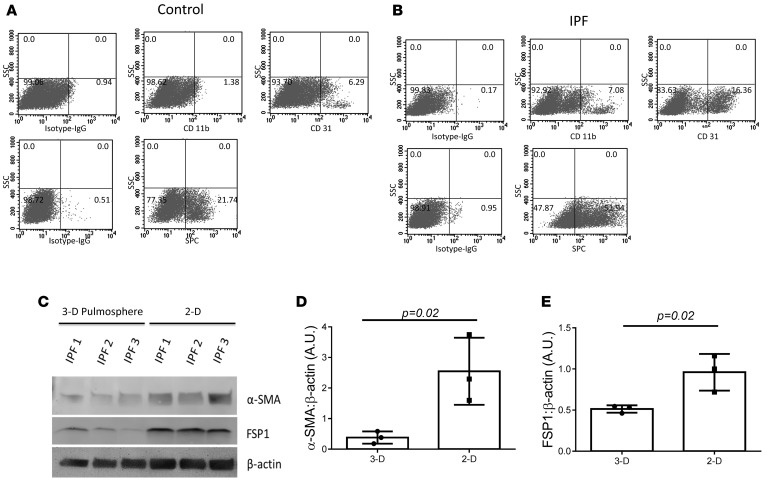
Figure 2. Cell phenotypes and protein expression in pulmospheres.
FACS analysis of cells of dissociated pulmospheres from (A) control subjects (n = 9) and (B) IPF patients (n = 20) for CD11b and CD31 (top) and SPC (bottom) gated for PE and AlexaFluor 647. PE-conjugated isotype and AlexaFluor 647–conjugated isotypes were used as controls. Seven pulmospheres from each control subject (n = 9) and IPF patient (n = 20) were used for FACS analysis. SSC, side scatter. (C) The representative Western blot for the expression of α-SMA and fibroblast-specific protein 1 (FSP1) in 3D and 2D grown cells from 3 IPF patients. β-Actin was used as loading control. (D and E) Quantitative densitometry of Western blots for (D) α-SMA and (E) FSP1. P = 0.02, compared with 3D, unpaired t test. Each dot represents one patient. The Western blotting was repeated independently twice.

