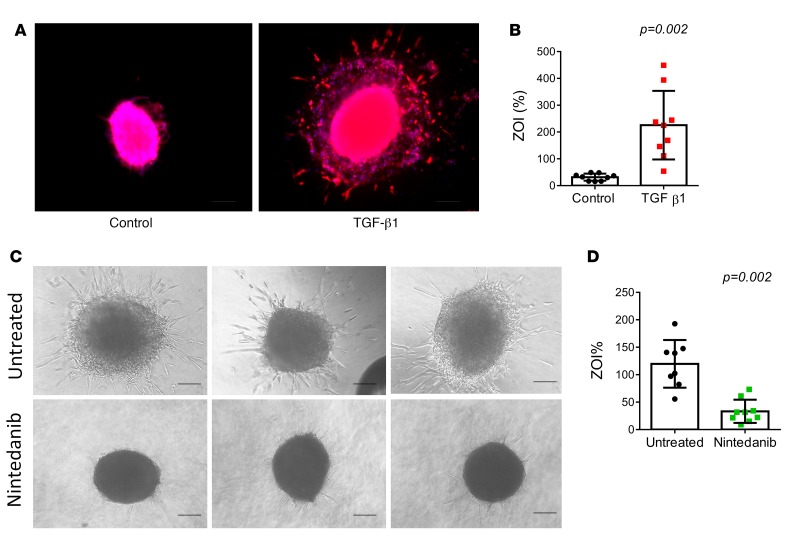
Figure 4. Modulation of invasiveness by treatment with TGF-β1 in control pulmosphere and with nintedanib in IPF pulmosphere.
(A) Representative pulmosphere from control lung not treated and treated with TGF-β1. Scale bar: 250 μm. (B) Calculated zone of invasion (ZOI) from 5 lung pulmospheres from 9 controls not treated and treated with TGF-β1. Each dot represents the mean value of calculated ZOI from 5 pulmospheres for each control subject. Data are expressed as mean (error bars) ± SD. P = 0.002, compared with control pulmospheres (untreated), 2-tailed paired t test. (C) Representative phase-contrast images of pulmospheres from a patient with IPF not treated and treated with nintedanib (1 μM) for 12 hours. Scale bar: 250 μm. (D) Invasiveness of pulmospheres from an individual patient not treated and treated with nintedanib. Each dot represents one pulmosphere. Data are expressed as mean (error bars) ± SD. P = 0.002, compared with untreated pulmospheres, 2-tailed paired t test.

