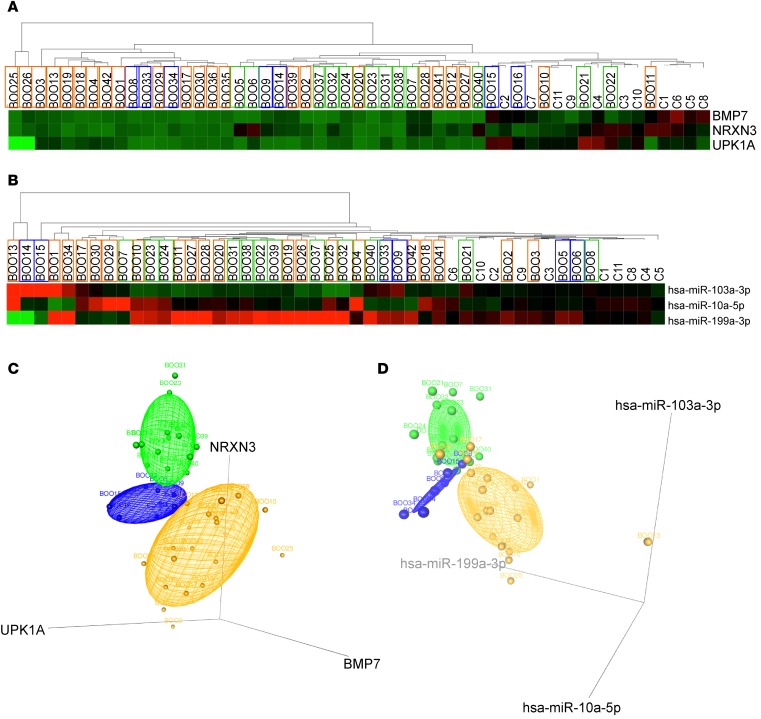
Figure 6. Testing the 3-mRNA and 3-miRNA bladder dysfunction signatures in a blinded study.
(A) Analysis of NRXN3, BMP7, and UPK1A mRNA expression in BOO patients of unknown urodynamic status and controls. Hierarchical clustering and heatmap of normalized Ct values of 3 signature mRNAs (y axis) in 40 patients and 11 controls (x axis). (B) Analysis of hsa-miR-103a-3p, hsa-miR-10a-5p, and hsa-miR-199a-3p miRNA expression in BOO patients. Hierarchical clustering and heatmap of normalized Ct values of 3 candidate miRNAs (y axis) in 38 BOO patients and 11 controls (x axis). Clustering of the miRNA results was similar to mRNA results, clearly separating controls from BOO patients. Using machine-based learning algorithms, the samples were allocated to phenotypic groups, represented by box border colors: green for DO (BOO with detrusor overactivity), blue for BO (BOO without detrusor overactivity), and orange for UA (underactive bladders) phenotypes. (C) 3D scatter plots for 3 mRNA biomarkers. Log2 fold change values of NRXN3, BMP7, and UPK1A mRNAs in bladder biopsies of 40 patients with unknown BOO states are plotted. Concentration ellipsoids are drawn to show the 3 patients groups (DO in green, BO in blue, and UA in orange). (D) 3D scatter plots and point identification for 3 miRNA biomarkers. Log2 fold change values of hsa-miR-103a-3p, hsa-miR-10a-5p, and hsa-miR-199a-3p miRNAs in bladder biopsies of 40 patients of unknown states of BOO are plotted. Ellipsoids are colored in green for DO-, blue for BO-, and orange for UA-allocated patients.

