
Figure 1.
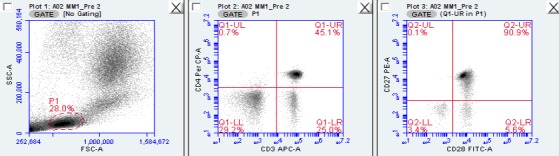
Representative flow cytometry plots from one experimental trial to illustrate gating strategy. In the FSC/SSC‐identified lymphocyte gate (‘P1’, left plot), CD3+ CD4+ cells (upper right quadrant of middle plot) were further characterized by CD27/CD28 expression (right plot).