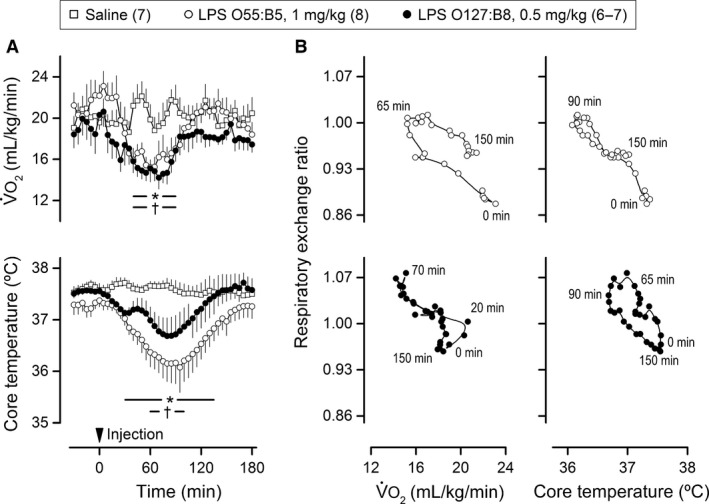
Figure 3.

The lipopolysaccharide (LPS)‐induced rises in respiratory exchange ratio are not consistently synchronized with the hypometabolic, hypothermic response. The experiment was conducted at an ambient temperature of 22°C. LPS or its vehicle (saline) was administered via extensions of IV catheters; LPS serotypes and doses are indicated. In (A), means ± standard errors for whole‐body oxygen consumption (O2) and core temperature are plotted as a function of time. The arrowhead marks the injection time. The numbers of animals in the experimental groups are shown in parentheses. The asterisk‐containing and the cross‐containing bars denote statistical difference (P < 0.05) in the groups injected with LPS O55:B5 and LPS O127:B8, respectively, as compared to the saline‐injected controls. In (B), phase‐plane plots are shown for the temporal relationships of the respiratory exchange ratio with either O2 or core temperature. The first point in each graph is from the time of the LPS injection (0 min), whereas the last point is from the time corresponding to the end of the responses of interest (150 min).
