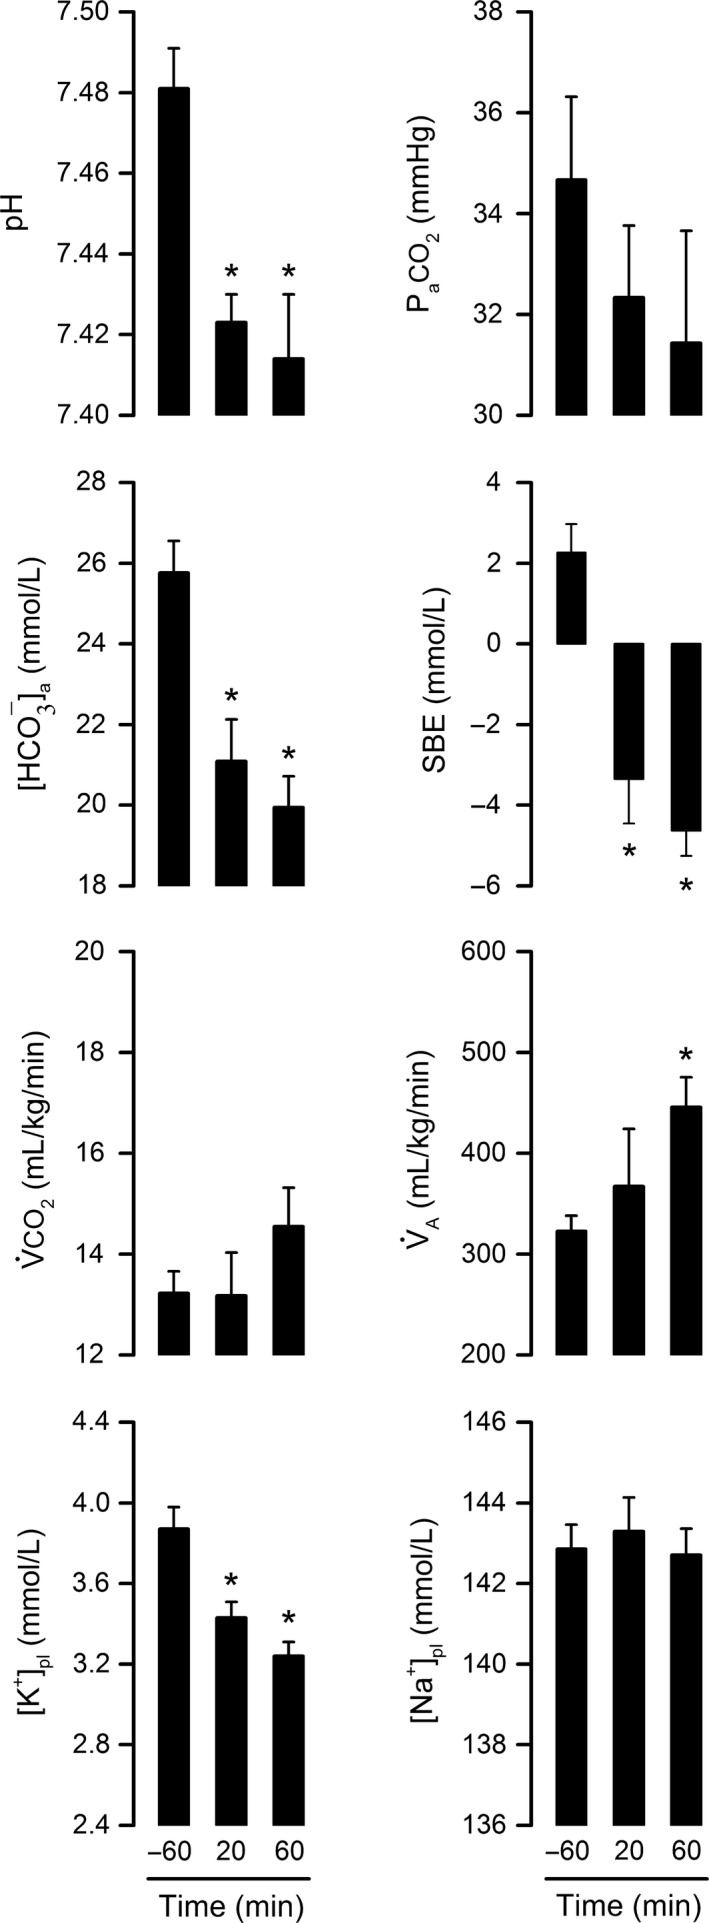
Figure 6.

Characteristics of lipopolysaccharide (LPS)‐induced metabolic acidosis in the warm environment (ambient temperature of 29°C). LPS O55:B5 was administered at the dose of 0.5 mg/kg via an IV catheter extension. Arterial blood was sampled at three crucial time points of the respiratory exchange ratio response: −60 min (baseline), 20 min (response onset), and 60 min (response peak). In addition to pH, the following parameters were assessed: Pa CO 2, arterial partial pressure of CO 2; [HCO 3 −]a, bicarbonate concentration in arterial blood; SBE, standard base excess; V̇CO 2, whole‐body CO 2 production; A, alveolar ventilation; [K+]pl, plasma concentration of potassium; and [Na+]pl, plasma concentration of sodium. Data are shown as means ± standard errors. Sample size was 5–7 for all time points. Each asterisk denotes a statistical difference (P < 0.05) from the baseline value (−60 min).
