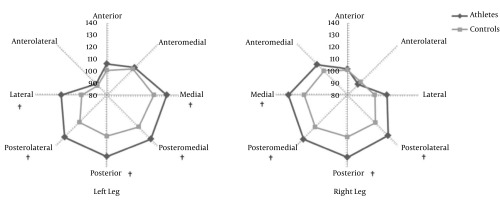
Figure 1. Distribution of the Mean Values of the Distances Relative to the Inferior Length of the Member (%) Measured During the Star Excursion Balance Test for Both the Left and Right Legs of Kitesurfing Athletes and the Control Group ((Distance / Leg Length) × 100).
† Significant differences in groups (P < 0.05). Left leg and right leg means the lower limb supported in the center of the test and not the free member that moved in different directions.

