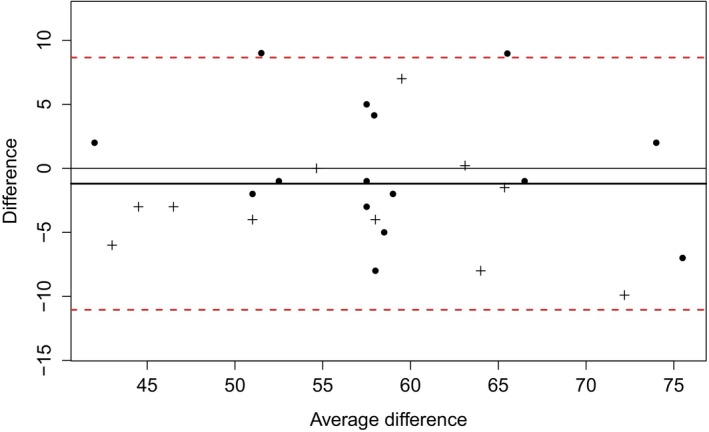
Figure 1.

Bland–Altman plot of test–retest variability. The difference between the test and retest is plotted against the mean of the difference for 26 participants (one excluded). Parkinson's disease patients are indicated with a + sign. The mean of the differences is shown as a bold black line and is close to 0, indicating low retest bias. The two dashed red lines are the 95% limits of test–retest agreement, which are approximately +/− 10 points, indicating moderate variability
