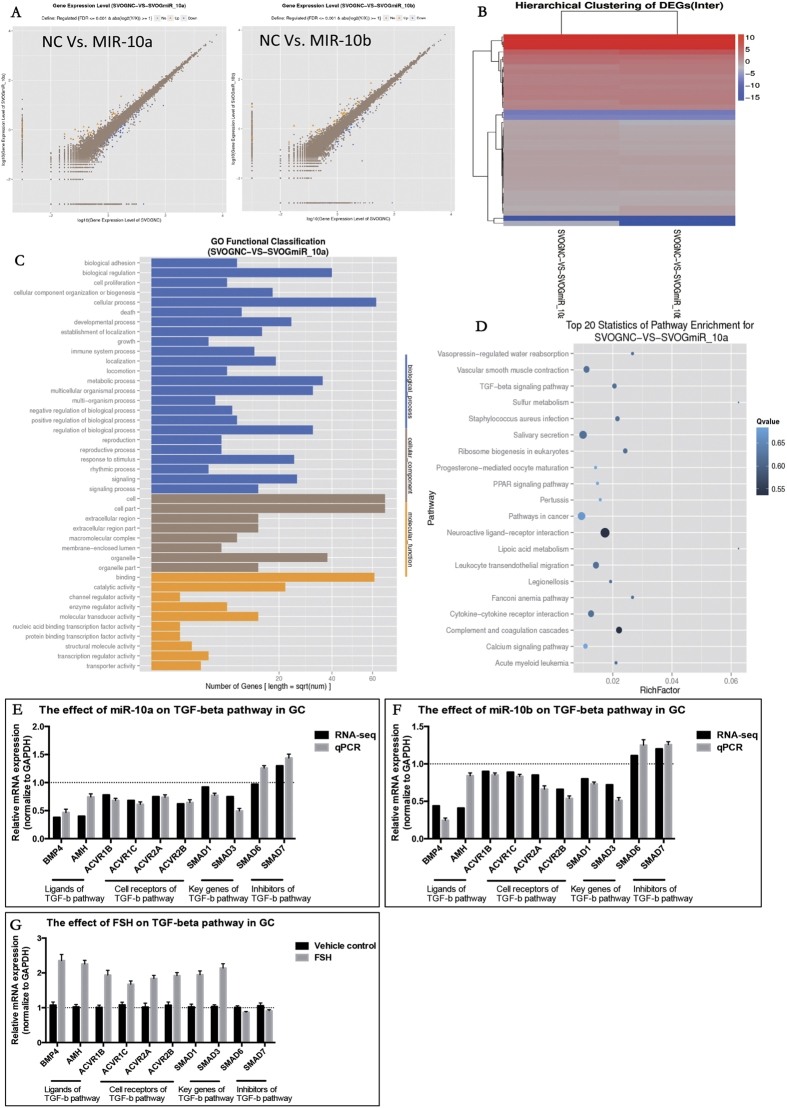
Figure 4. The effect of the miR-10 family on GCs on a transcriptome-wide scale.
(A) Scatter chart of all the expressed genes in GCs overexpressing miR-10a and miR-10b by RNA-seq. (B) Hierarchical clustering of the DEGs in GCs overexpressing miR-10a and miR-10b. (C) Gene Ontology analysis in GCs overexpressing miR-10a and miR-10b. (D) Pathway analysis in GCs overexpressing miR-10a and miR-10b (E) The effects of miR-10a/b on key factors in the TGF-β pathway.

