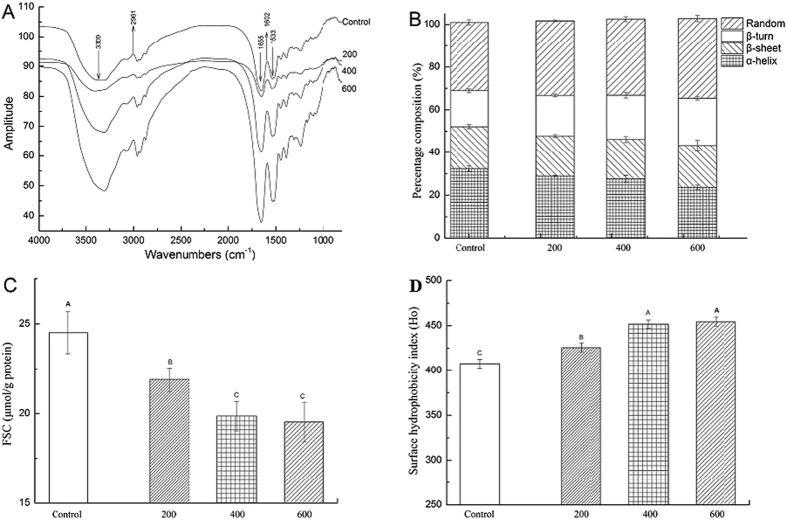
Figure 2.
FTIR spectrum (A), secondary structure (B), and tertiary structure (C,D) of different HHP-treated squid Hc samples. (B) α-helix, β-sheet, β-turn, random: percentage composition (%) of secondary structure from FTIR spectrum. (C) FSC, μmol/g protein and (D) Ho indexes were 200, 400, and 600 for the HHP treatments maintained at 200 MPa, 400 MPa, and 600 MPa for 20 min, respectively.

