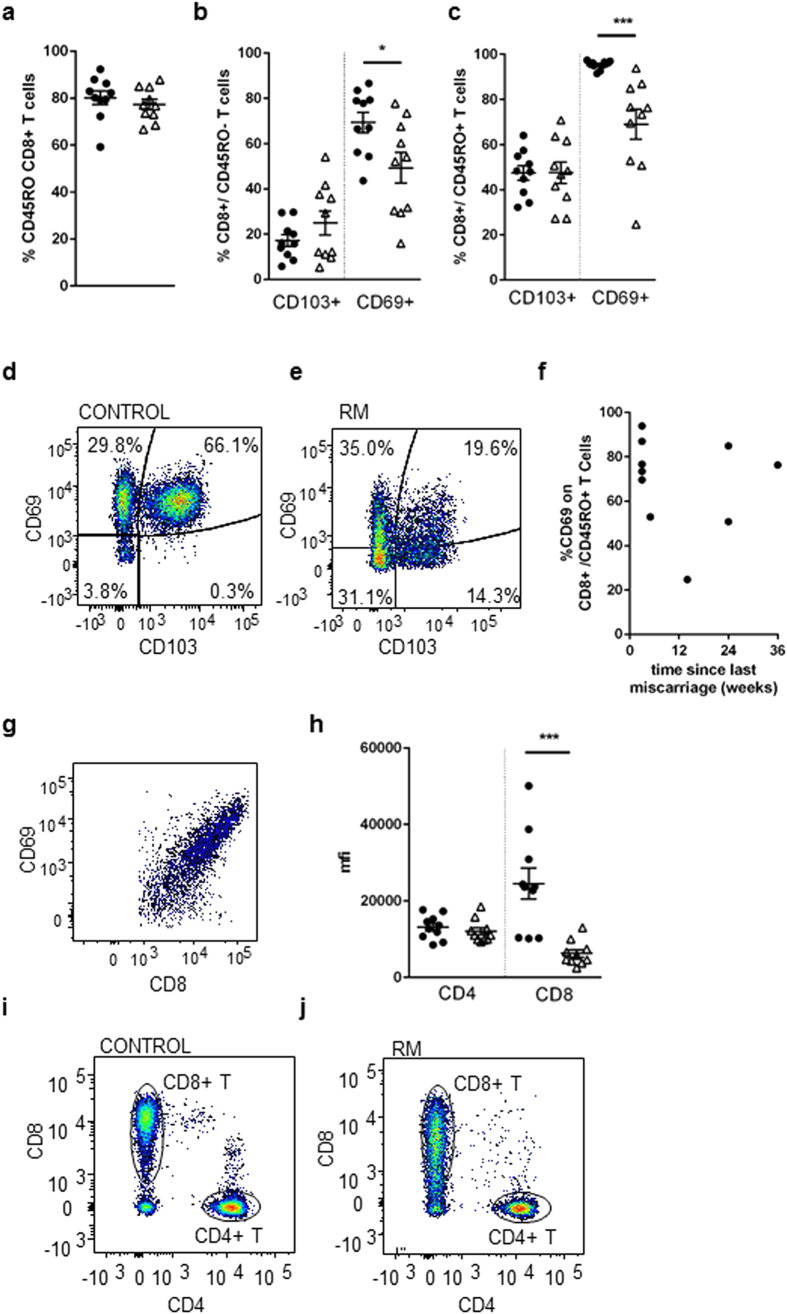
Figure 2. Phenotypic analysis of CD8+ endometrial T cells by flow cytometry.
Endometrial CD3+CD8+ T cells from 10 controls (•) or 10 RM (Δ) were stained with antibodies CD3-PeCy5, CD8-PECy7, CD45RO-APCCy7, CD103-FITC, CD69-PE with FMO controls. The proportion of cells expressing CD45RO (a) and CD103 and CD69 expression was determined on CD45R0−’ve (b) and CD45RO+ ’ve (c) CD3+/CD8+ T cell populations. Representative example of flow cytometry staining profile of CD103 and CD69 on control (d) and RM (e) CD8+CD45RO+ cells. CD69 expression on CD8+CD45RO+ cells in RM women versus time since last miscarriage (weeks) (f) and showing CD8 and CD69 correlative expression (g). The mean fluorescence intensity of the CD4 and CD8 co-receptor on samples was also calculated (h), representative flow cytometry images of CD8 and CD4 staining on CD3-T cells from control (i) and RM (j) women. Bars represent mean+/− S.E.M. For significance values a Student’s t-test comparison of controls and RM was performed.

