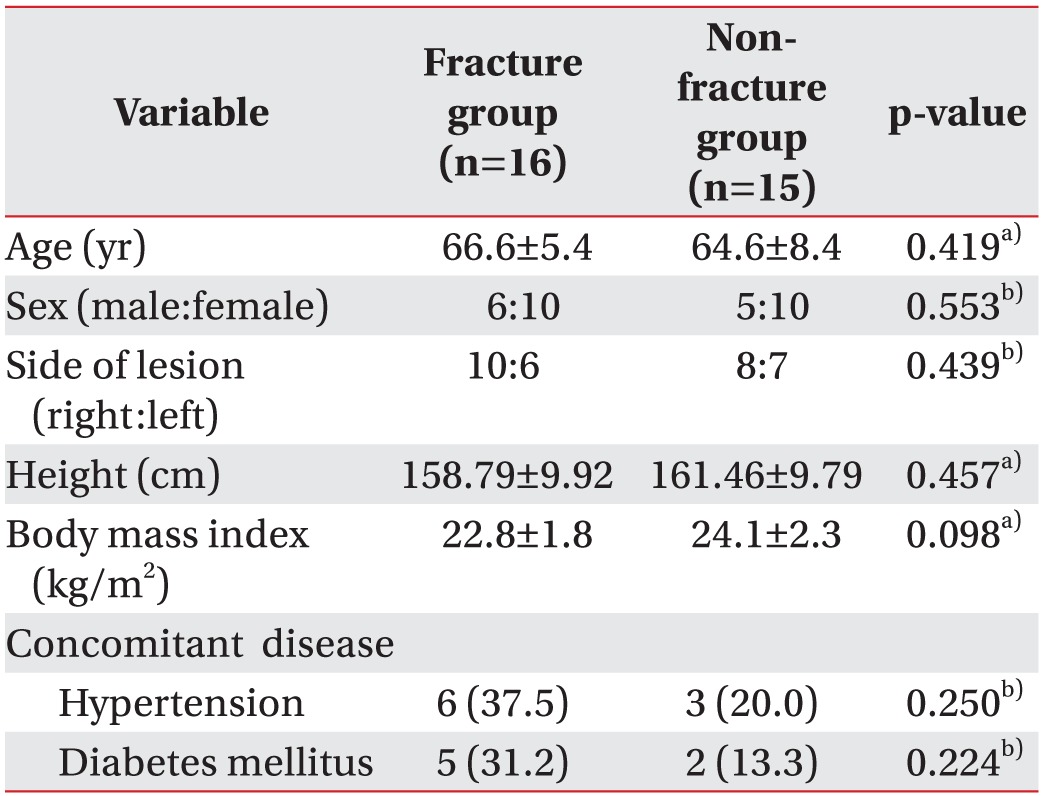
Table 1. Demographic data of all participants.

Values are presented as mean±standard deviation or number (%).
a)The independent t-test, b)the chi-square test.

Values are presented as mean±standard deviation or number (%).
a)The independent t-test, b)the chi-square test.