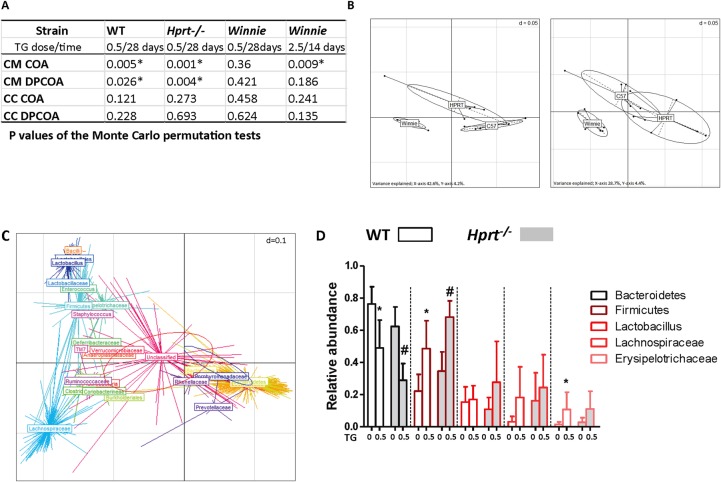
Figure 4.
The caecal mucosa (CM)-associated microbiome shifted with thioguanine (TG) treatment. The effect of once daily gavage TG 0 or 0.5 for 28 days in wild-type (WT), hypoxanthine (guanine) phosphoribosyltransferase (Hprt)−/− and Winnie, or TG 2.5 for 14 days in Winnie, on caecal contents (CC) and CM microbiomes was investigated by correspondence analysis (COA) and double principal coordinates analysis (DPCOA). (A) p Values of the Monte Carlo permutation tests indicating whether or not the resident communities of treatment and control groups differed significantly; (B) DPCOA based on the bacterial community profiles of the CM samples from all three strains of mice. Left—control samples, right—TG-treated samples. The panels represent similarities between sample profiles, with samples from the same strain grouped together; (C) DPCOA based on the bacterial community profiles of the CM samples from the WT mice. There are two ellipses, one red and one blue, which represent the collective variance of each treatment (blue control; red TG). The position of each centroid point (with a radiating star-like structure) represents the association of each OTU with each sample. Points are coloured and collectively labelled based on their taxonomy (obtained from the Ribosomal Database Project algorithm, rank level chosen to facilitate visualisation). The analysis indicates a strong partitioning of the samples based on treatment type driven by the relative abundances of Bacteroidetes (but possibly not Rikenellaceae and Prevotellaceae within this clade) and several groups within the Firmicutes and (D) relative abundances of chosen phylogenetic groups from WT and Hprt−/− CM samples (observed differences between control and TG treatments were analysed using a Wilcoxon test (a=0.05, false discovery rate (FDR)). N=6. Statistical analysis: *p<0.05).

