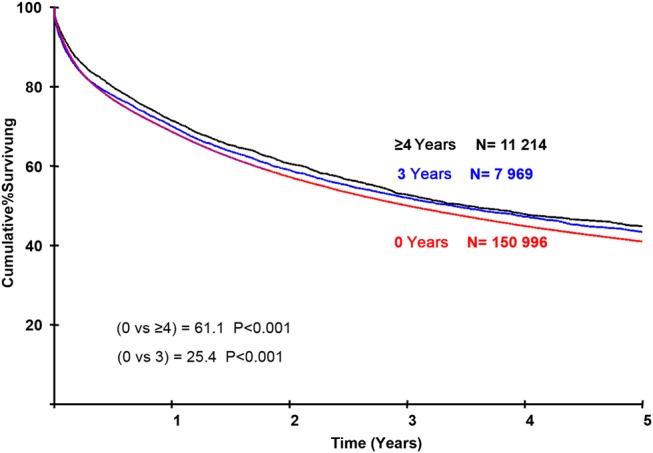
Figure 3.

Adjusted survival curves for patients treated in institutions with high research participation. It shows the cumulative survival for patients treated in institutions that have ≥16% participation in interventional clinical trials for 0, 3 or ≥4 years. At the scale of this graph the results for 1 and 2 years are superimposable over that for 0 years. The curves are highly significantly different and show that the separation occurs principally in the first year of follow-up. Survival is adjusted for primary procedure, index admission, Dukes’ stage, age, deprivation and Experimental Cancer Medicine Centre status.
