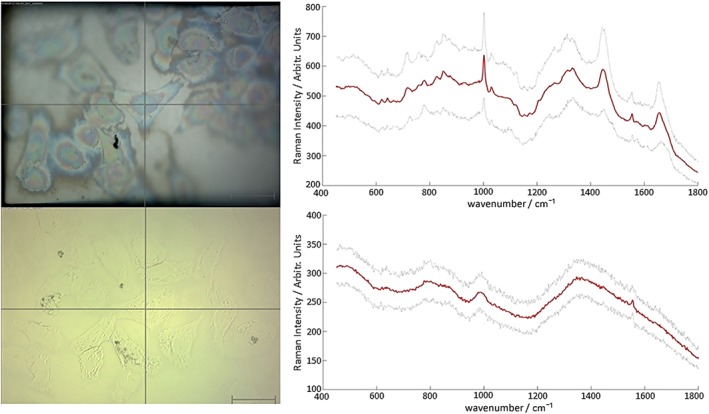
Figure 3.

Upper panels show the median Raman spectrum from a cell map on steel (red line) along with error shown as a sleeve of two standard deviations (grey lines, top right) and corresponding white light image (top left). Lower panels show the median Raman spectrum from a cell map on CaF2 (red line) with error shown as a sleeve of two standard deviations (grey lines, lower right) with corresponding white light image (lower left). Scale bars represent 50 µm.
