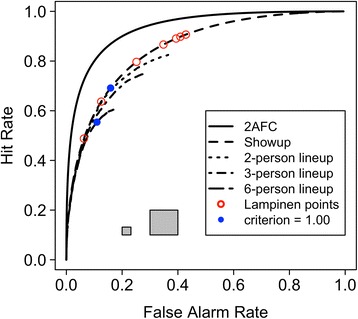
Fig. 1.

Simulated receiver operating characteristic curves (ROCs) assuming true d′ = 1.5 and equal variance Gaussian distributions for five different recognition memory tasks. The larger gray square shows an area under the ROC (AUC) = 0.01; the smaller gray square shows an AUC = 0.001. Points marked with a red open circle are the operating points simulated by Lampinen (2016); points marked with a blue filled circle are the operating points that result from a decision criterion of 1.00 in the showup and six-person lineup tasks. 2AFC = two-alternative forced choice
