Fig. 4.

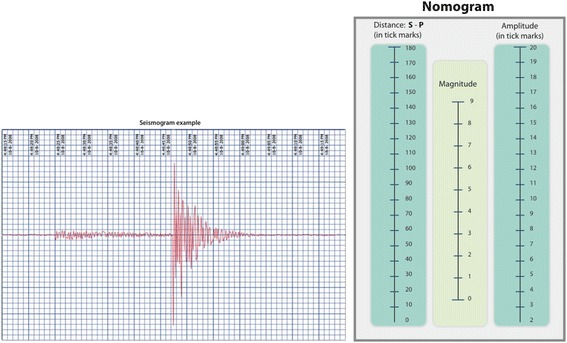
An example seismogram (left) where the first, shorter wave is the primary wave and the second, taller wave is the secondary wave. Students used the primary and secondary wave measurements to determine the magnitude using the nomogram (right)

An example seismogram (left) where the first, shorter wave is the primary wave and the second, taller wave is the secondary wave. Students used the primary and secondary wave measurements to determine the magnitude using the nomogram (right)