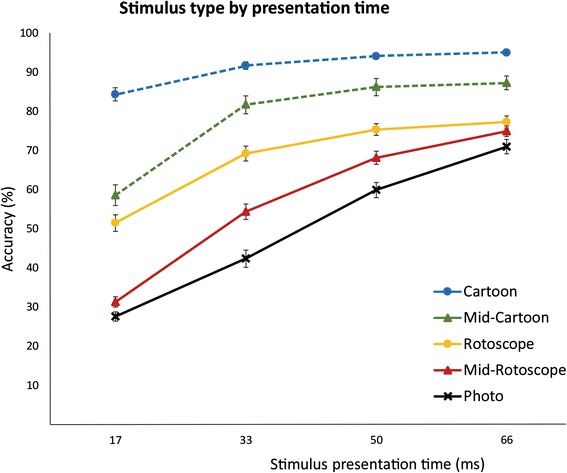
Fig. 3.

Accuracy rate for five stimulus categories at each presentation time for Experiment 1. Error bars represent standard error of the mean. Dotted lines denote low featural complexity stimuli, with solid lines as high featural complexity stimuli. Circle markers denote high contrast stimuli, with triangles as low contrast stimuli. Photo, the baseline stimulus set, in marked in black. Chance is at 25 %
