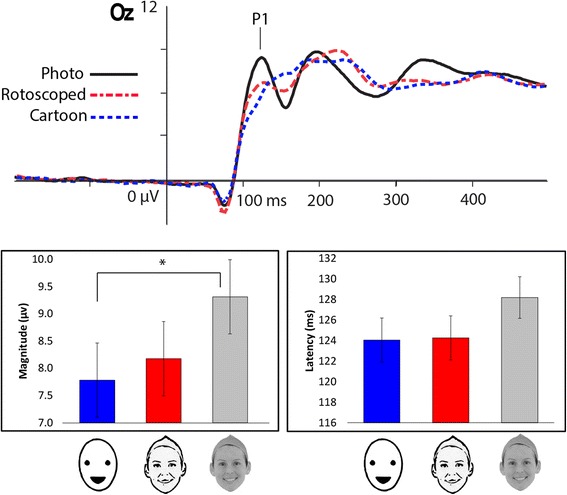
Fig. 5.

P1 data at sensor Oz for Experiment 2. The waveforms at the top show the three stimulus sets averaged across all participants. The charts below represent the latencies and amplitude of those individual peaks averaged together. * Significant difference at P < 0.05
