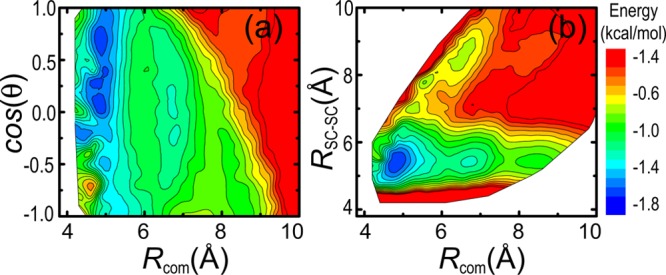
Figure 5.

Two-dimensional energy landscape of two interacting leucine amino acids as a function of the center-of-mass distance Rcom and their relative angle θ (a) and of Rcom and a SC–SC distance RSC–SC (b). The color bar represents the lowest interacting energy that each configuration can have at its corresponding location.
