
Fig. 3.
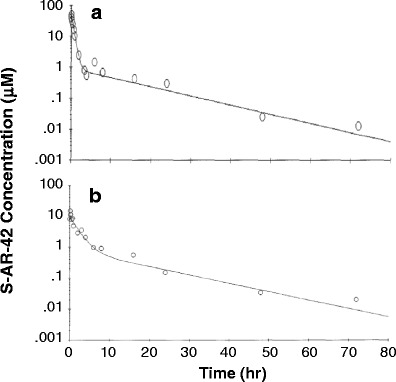
Plasma concentration-time profile of S-AR-42 in the mouse following i.v. (a) and p.o. (b) administration at 20 and 50 mg/kg, respectively. Data points represent means of six replicates at each time point, and lines are fitted data using a two-compartment model