
Fig. 4.
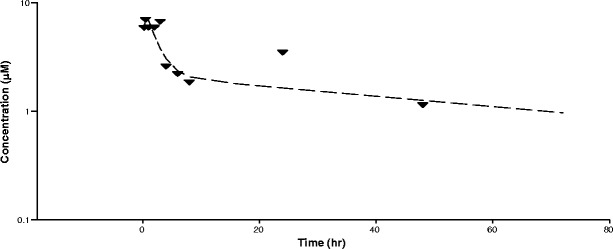
Concentration of AR-42 in mouse bone marrow following the last of eight oral doses at 40 mg/kg. Data represent mean of n = 3 measurements per time point. The line was generated from fitting to a two-compartment model with extravascular input and weighting = 1/year2