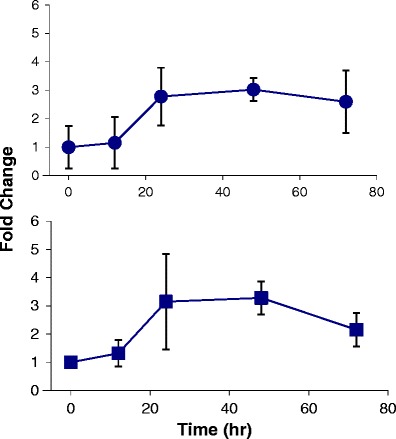
Fig. 5.

miR-29b expression vs. time profiles for bone marrow (top, circles) and spleen (bottom, squares) in AML-induced NGS mice. Data are fold change in expression relative to the pre-dose measurement (mice not dosed with AR-42). Data are presented as means of n = 3 measurements ± standard deviations
