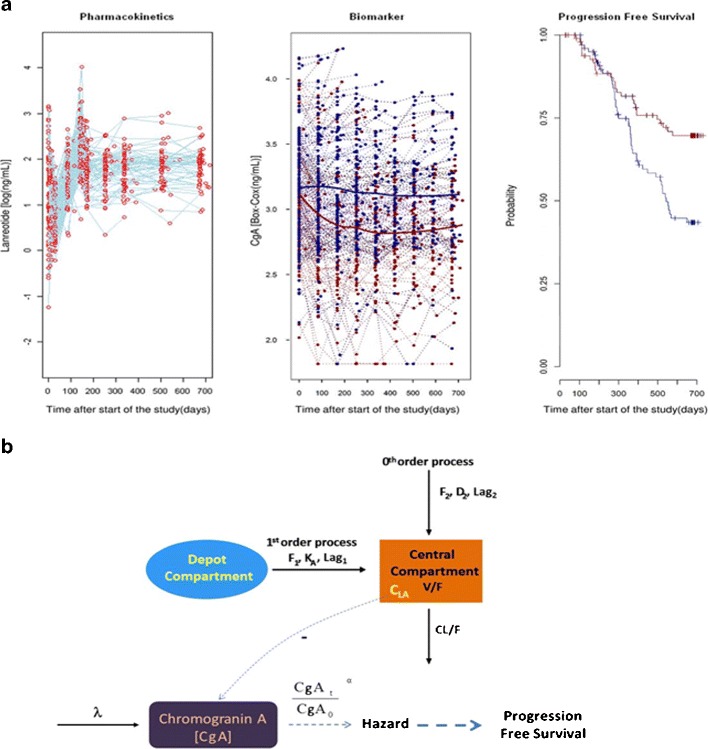
Fig. 1.

a Representation of available data included in the analysis: time profile of LAN concentrations (left), serum CgA biomarker profiles (center), and Kaplan-Meier of PFS (right). Dots in the left and center panels correspond to individual observations. Blue and red lines in the center and right panels depict the median time profiles for placebo- and LAN-treated patients, respectively. b Schematic representation of the PK/PD model for LAN, CgA, and PFS
