Fig. 4.

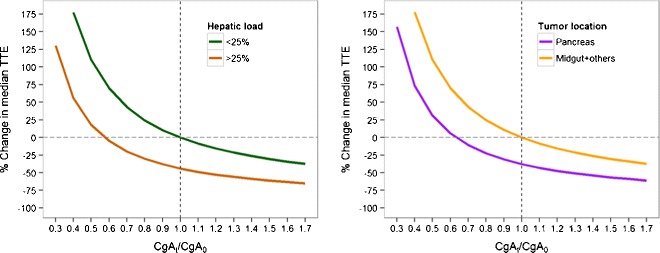
Relationship between CgAt/CgA0 ratio and median time to event (MTTE, i.e., time to disease progression) for different hepatic tumor loads (left panel) and tumor locations (right panel), assuming constant CgA levels at steady state

Relationship between CgAt/CgA0 ratio and median time to event (MTTE, i.e., time to disease progression) for different hepatic tumor loads (left panel) and tumor locations (right panel), assuming constant CgA levels at steady state