
Fig. 2.
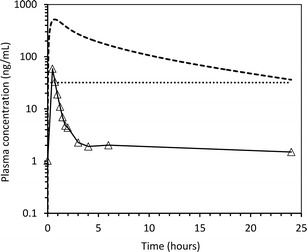
Phase 1 clinical PK data for AZ12470164. The open triangles represent geometric mean plasma concentrations determined from patients (n = 3) who received a single oral 80-mg dose. The dotted line is the biological effective target concentration derived from the quantitative PKPD-efficacy relationship in tumour-bearing mice. The dashed line is simulated steady-state oral PK profile for a 154-mg dose