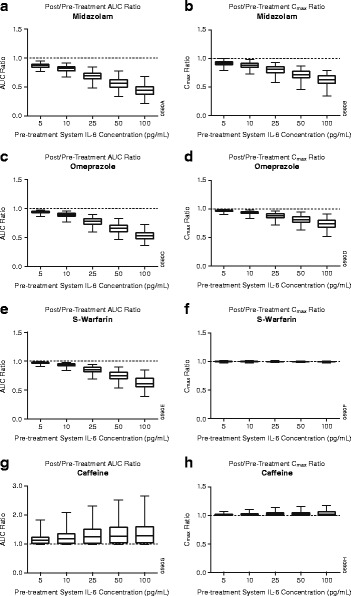
Fig. 4.

Predicted post-/pre-sirukumab treatment area under plasma concentration versus time curves (AUC0–infinity) and peak plasma concentration (C max) ratios of cytochrome p450 enzyme substrates for midazolam (a, b), omeprazole (c, d), S-warfarin (e, f), and caffeine (g, h) in patients with different pre-treatment systemic interleukin-6 (IL-6) levels. The data are represented in box and whisker plots
