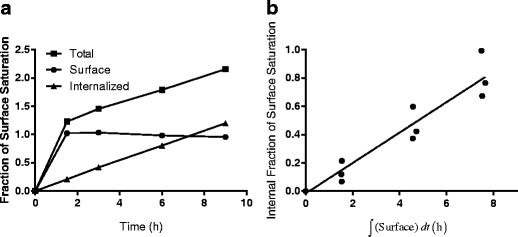
Fig. 2.

Determination of internalization rate constant, k e. a Representative plot of the normalized Alexa Fluor 647 signal (total antibody), normalized Alexa Fluor 488 signal (surface-bound antibody), and internalized (total–surface) antibody versus time for BT-474 cells treated with 10 nM TM-ADC-647 and stained with an Alexa Fluor 488 antihuman antibody. The y-axis is fraction of the normalized surface saturation level, which is either Alexa Fluor 647 or Alexa Fluor 488 MFI normalized as described in the “MATERIALS AND METHODS” section. b Fit of internalization rate using the internalized fraction of TM-ADC-647 versus surface integral as given by Eq. 7. A representative plot for TM-ADC-647 internalization in BT-474 cells is shown here. The equivalent plots for other cell lines and Tras-647 are shown in Supplemental Fig. 3. Fit values for the internalization rate constants for Tras-647 and TM-ADC-647 are presented in Table I
