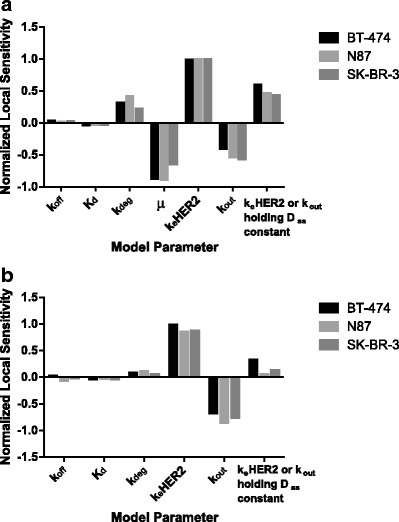
Fig. 5.

Local sensitivity analysis for model parameters (a) with cell growth rate (μ) equal to untreated cell growth rate or (b) with no cell growth. Sensitivity was calculated based on variations in the area under the curve for released payload after 10 days of treatment with 10 nM TM-ADC-647 with 10% perturbations in the indicated model parameter
