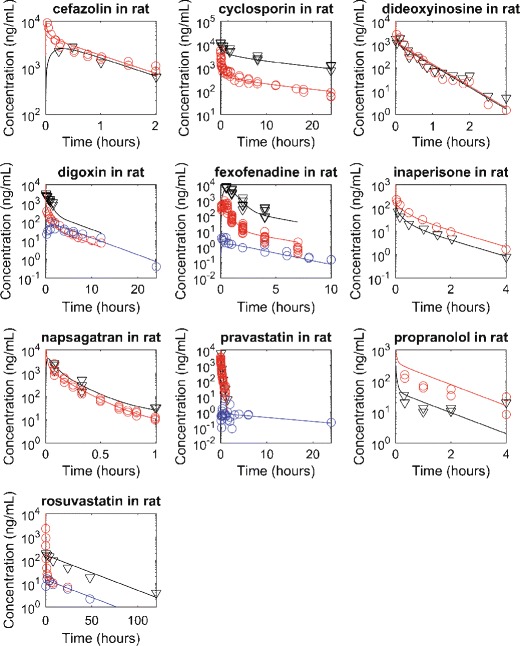
Fig. 1.

Observed and simulated rat systemic and liver concentration-time profiles. Red, blue, and black represent systemic concentration after intravenous dosing, systemic concentration after oral dosing, and liver concentration, respectively. The markers and lines represent observations and simulations. The dosing amounts have been scaled to 1 mg/kg, assuming linear clearances
