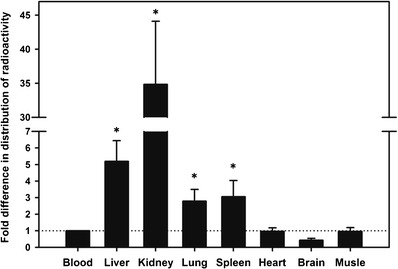
Fig. 3.

Tissue penetration of 3H-1329. Fold difference in tissue distribution of radioactivity compared to amount in whole blood (after normalizing the distributions to μCi/mL or μCi/mg of blood or tissue). Values are expressed as mean ± SD. The horizontal dotted line indicates the reference value
