Fig. 5.

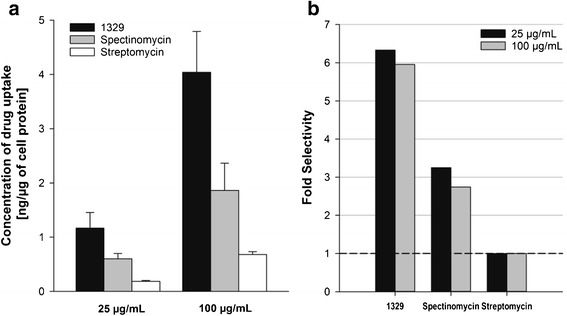
Macrophage cellular uptake. a Average (±SEM) concentration of drug uptake in macrophages after 24 h of incubation at drug concentrations of 25 and 100 μg/mL (N = 6). b Fold difference in cellular uptake of 1329 and spectinomycin as compared to streptomycin at both concentration levels after 24 h of incubation. The horizontal dashed line specifies the reference line
