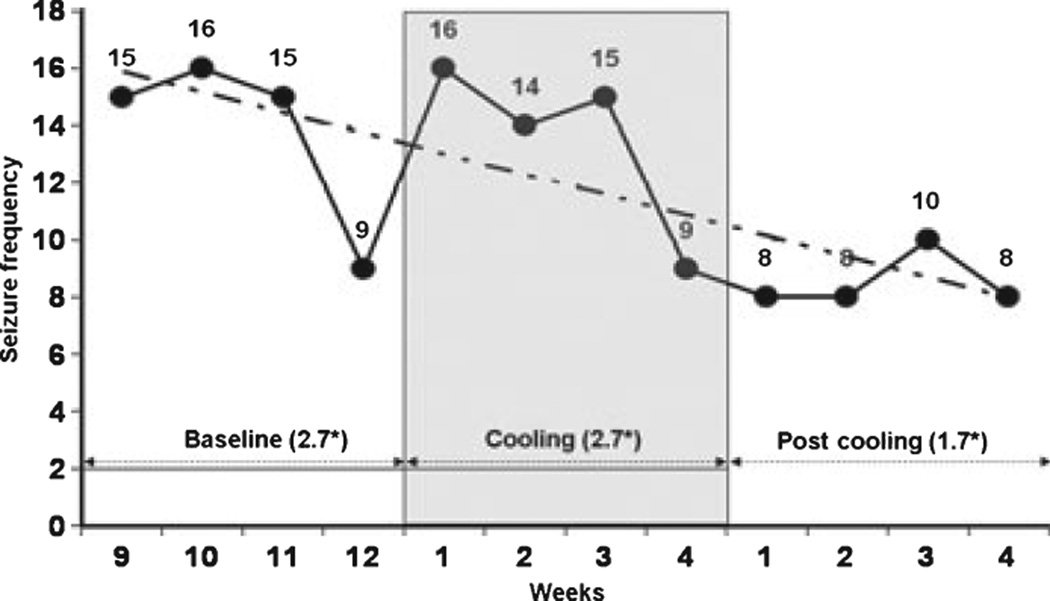
Figure 2.
Weekly group seizure frequency (thick line) with a linear trend (broken line) and overall average* [*weekly 4-week average seizure frequency = all seizures for the group over the respective 4 weeks/20 · (five patients × 4 weeks)] during 4-week of baseline phase immediately prior to cooling, 4-week cooling phase and 4-week follow-up phase. The decrease in a weekly group 4-week average seizure frequency was statistically significant at 5% threshold level using the MANOVA (F = 15.202, DF = 2, Significance < 0.05)].

