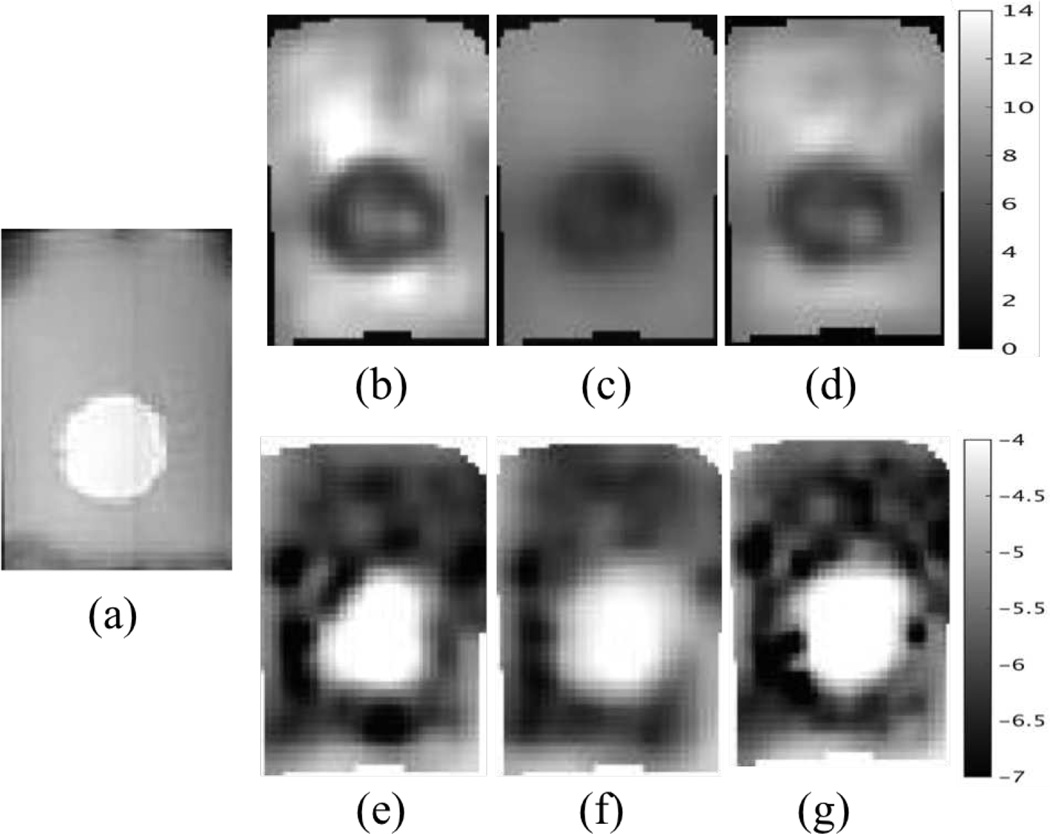
Fig. 10.
Representative slices of reconstructed tofu properties. (a) T2 weighted image. (b–d) Real shear modulus using CG, QN and GN, respectively. (e–g) Real hydraulic conductivity using CG, QN and GN, respectively. The shear modulus is displayed in units of kPa, and the hydraulic conductivity is in units of m3s/kg and is presented in Logarithm scale.

