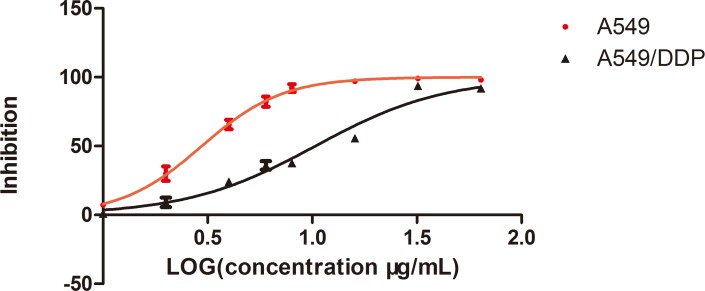
Fig 2. The inhibitory effects of different concentrations of cisplatin (DDP) on A549 and A549/DDP cells.
Cell viability, as assessed by the CCK-8 assay, was determined 24 h after exposure of A549 or A549/DDP cells to increasing amounts of cisplatin. Results represent the average of triplicate wells and are representative of three independent experiments. Black bars and symbols, A549/DDP; red bars and symbols, A549.

