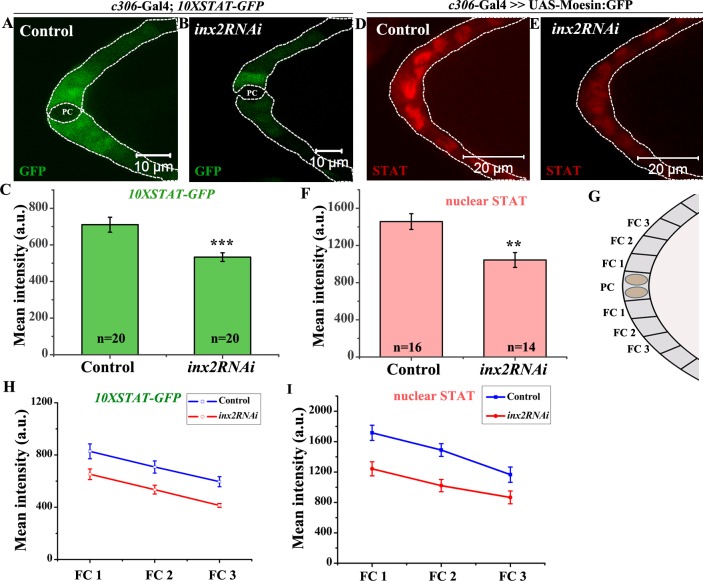
Fig 2. Loss of inx-2 leads to compromised STAT signaling and STAT levels in the follicle cells.
(A, B, D, E): White dotted line outlines anterior follicle cells of Stage 8 egg chamber of indicated genotypes. (A-B): 10XSTAT-GFP expression. PC denotes polar cells. (C): Histogram compares 10XSTAT-GFP levels for genotypes represented in (A) and (B). (D, E): STAT expression (Red). (F): Histogram comparing nuclear STAT level for genotypes represented in (D) and (E). Note the decrease in the levels of both 10XSTAT-GFP and STAT protein in Inx2-depleted follicle cells. (G): Schematic of anterior end of stage 8 egg chamber. FC stands for follicle cell. (H-I): Graph represents 10XSTAT-GFP (H) and nuclear STAT (I) level in FC1, FC2 and FC3 between control and inx2RNAi. Error bar represents Standard Error of Mean. ‘n’ indicates number of egg chambers analyzed. ** p-value <0.01.*** p-value <0.001.

