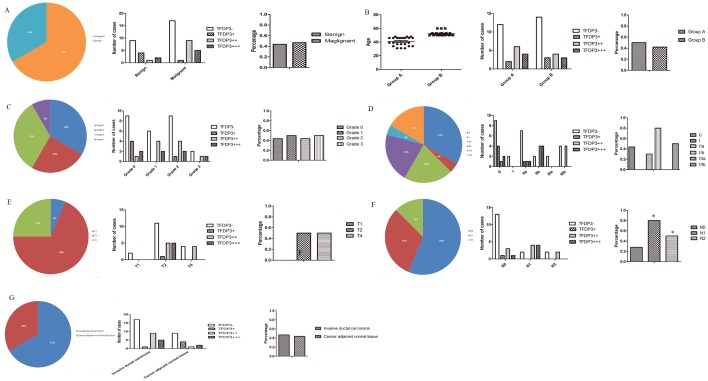
Fig 3. Statistical analysis of TFDP3 expression in tissue microarray BR486.
(A-B) TFDP3 expression in different pathological types and age groups. (C-D) TFDP3 expression in samples of different pathological grades and clinical stages. (E-F) TFDP3 expression in the T and N stages. (G) TFDP3 expression in samples of different pathological diagnoses.

