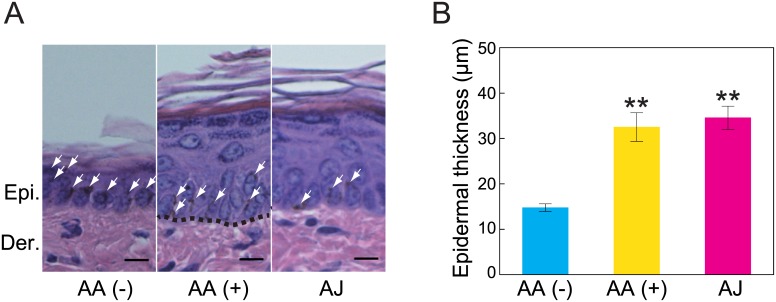
Fig 2. The effect of acerola juice intake on epidermal morphology and thickness.
(A) High magnifications of the epidermis from the skins of the AA (-), AA (+) and AJ groups are shown. The white arrows indicate the skin pigment. (B) The epidermal thicknesses in the HE-stained sections were measured as the distance between the top of the basement membrane and the bottom of the stratum corneum in five fields randomly selected from each animal. The values are expressed as the means ± the SEMs of five animals. ANOVA analysis: F2, 12 = 20.6, P < 0.001. The asterisk indicates a significant difference (**P < 0.01) compared with the AA (-) group by Tukey’s HSD post hoc comparisons. AA, ascorbic acid; AJ, acerola juice; Der., dermis; Epi., epidermis. Bar = 10 μm.

